 Polish Polar DataBase
discharge, runoff
Type of resources
Available actions
Topics
Keywords
Contact for the resource
Provided by
Representation types
Update frequencies
status
-
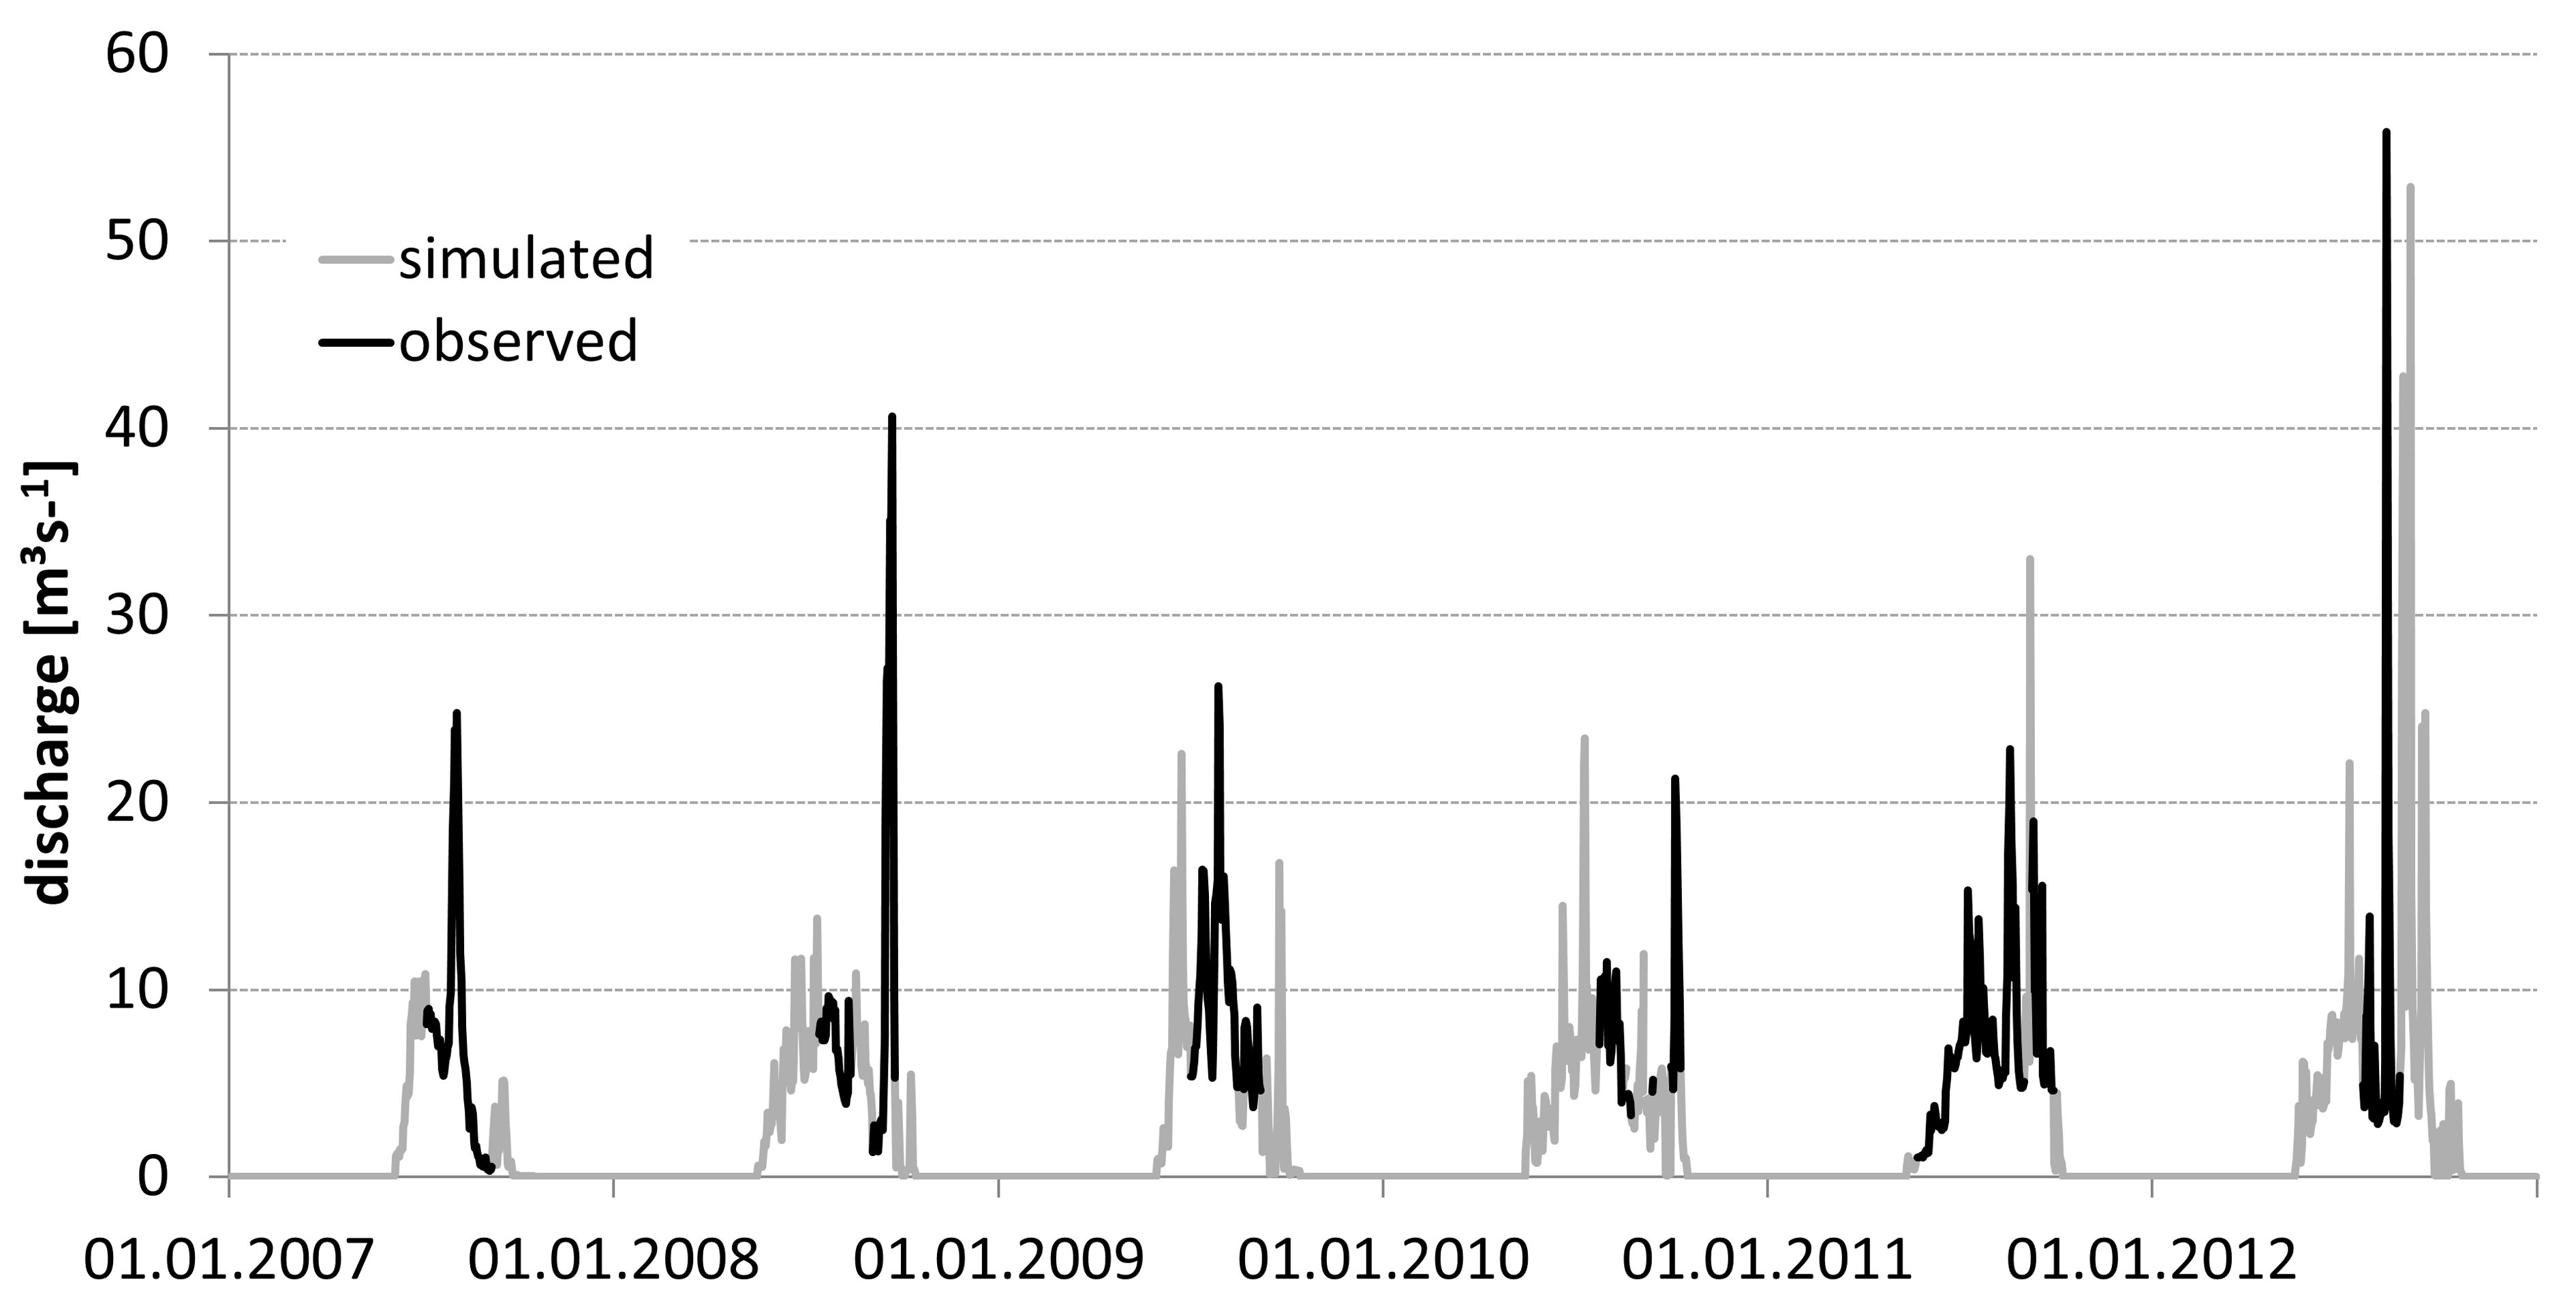
• Discharge measurements were conducted from May/June/July to September/October in the years 2007–2012. Direct observation periods were 62, 51, 61, 40, 121, and 35 days in the consecutive years. The data set was obtained from CTD-DIVER DI 261 or Mini-Diver (Van Essen Instruments, Delft, The Netherlands) logger with barometric compensation by BaroDiver (Schlumberger, Houston, TX, USA) with 10-min intervals and flow velocities were measured with a SEBA F1 current meter (SEBA Hydrometrie GmbH, Kaufbeuren, Germany). Mean daily discharge and total runoff in the hydrologically active season was calculated on the basis of the 24h running average of the water level and a rating curve (Appendix 1). More details have been reported by Majchrowska E., Ignatiuk D., Jania J., Marszałek H., Wąsik M., 2015: Seasonal and interannual variability in runoff from the Werenskioldbreen catchment, Spitsbergen. Polish Polar Research vol. 36, no. 3, pp. 197–224. doi: 10.1515/popore−2015−0014 • Hydrological data for Werenskioldbreen - archive of the University of Silesia. The base contain mean daily discharge in the years: 1970, 1971, 1972, 1973, 1974, 1979, 1980, 1983, 1985, 1986, 1988, 1998, 2007, 2008, 2009, 2010, 2011, 2012, 2013, 2017, 2019 (21 hydrologically active seasons) – Appendix 2